Retirement Planning5 min read•Last updated: July 2026
How Much Money Do You Actually Need to Retire in the UK?
Research suggests many retirees report high levels of satisfaction on incomes below the pensions industry's 'comfortable' retirement targets.
If you read mainstream financial headlines, you have likely seen some challenging numbers. Many pension providers and financial firms frequently warn savers that they need a retirement pot of £500,000 to well over £1 million to secure a decent lifestyle. For the average worker, these targets do not motivate saving—they can create anxiety and a feeling of uncertainty.
But there is a gap between the targets often marketed to us and the lived reality of British retirees. Research suggests many retirees report high levels of satisfaction on incomes below the industry's "comfortable" retirement targets, naturally reduce their spending as they age, and find deep satisfaction at lower wealth thresholds.
Let's break down the official figures, look at what real people actually spend, and find your genuine retirement number.
1. The "Official" Targets vs. Real-World Pension Pots
Every year, the Pensions and Lifetime Savings Association (PLSA) publishes its Retirement Living Standards. These figures define what a single person or a couple needs to achieve a "Minimum", "Moderate", or "Comfortable" lifestyle.
The table below outlines the official 2026/27 annual income targets alongside the actual private pension pots the industry claims you need to build to hit them. To keep this realistic, we have factored in the full New State Pension of £12,548 a year (£241.30 per week) to show the actual net shortfall you need to bridge yourself.
Use our interactive calculator below to adjust your target retirement age and see how the required pot changes depending on your gap years:
🧮 Interactive Target Calculator
This simplified model illustrates the shape of the ISA-bridge-plus-SIPP structure using the same engine as our full calculator. For a personalised projection based on your own savings, contributions, and expected returns, use our full calculator.
50 (Early SIPP access)67 (State Pension kicks in)
* Assumed annual growth rates are in real terms (above inflation).
Bridge Duration
7 gap years
From age 60 to 67
Safe Withdrawal Rate
3.64% SWR
Adjusted for retirement length
🏕️
Minimum Tier
Covers food, basic housing, and minimal leisure. No car.
Target Net Annual Income
£13,900
Phase 1: ISA Bridge (7 yrs)£84,992
£13,900 / year (fully self-funded)
Phase 2: SIPP (Age 67+)£37,143
£1,352 / year shortfall (after £12,548 State Pension)
Total Pot Required
£122,135
(+£88,335 vs retiring at 67 due to gap years and lower SWR)
🏡
Moderate Tier
More flexibility, eating out, one running car, and a holiday.
Target Net Annual Income
£32,700
Phase 1: ISA Bridge (7 yrs)£199,946
£32,700 / year (fully self-funded)
Phase 2: SIPP (Age 67+)£553,626
£20,152 / year shortfall (after £12,548 State Pension)
Total Pot Required
£753,572
(+£249,772 vs retiring at 67 due to gap years and lower SWR)
🏰
Comfortable Tier
Financial peace of mind, premium holidays, beauty treatments, upgrades.
Target Net Annual Income
£45,400
Phase 1: ISA Bridge (7 yrs)£277,600
£45,400 / year (fully self-funded)
Phase 2: SIPP (Age 67+)£902,527
£32,852 / year shortfall (after £12,548 State Pension)
Total Pot Required
£1,180,127
(+£358,827 vs retiring at 67 due to gap years and lower SWR)
💡
Early Retirement Insight: Notice how the total pot requirement increases. For instance, retiring at 60 adds 7 gap years where your private savings must cover 100% of your expenses before your State Pension of £12,548/yr starts. We also reduce the Safe Withdrawal Rate from 4.0% to 3.64% because your money has to last for a longer retirement.
The Stark Savings Reality
Now let's look at what the UK actually has. Data from the Office for National Statistics (ONS) reveals that the median private pension wealth for individuals nearing retirement (aged 55–64) sits between £107,000 and £137,800. When you include the millions of adults with zero pension savings at all, the true national median pot drops to a mere £19,700.
These figures also highlight the gap between aspirational retirement targets and the financial reality faced by many UK households. Yet, the average actual income for a single UK retiree is £14,664 per year (£282 a week), and for couples, it is £30,940. Most people live below the official "Moderate" targets—so how are they actually doing?
2. The Economics of Happiness: You Need Less Than You Think
When researchers stop looking at hypothetical shopping baskets and start looking at real human beings, a very different picture emerges.
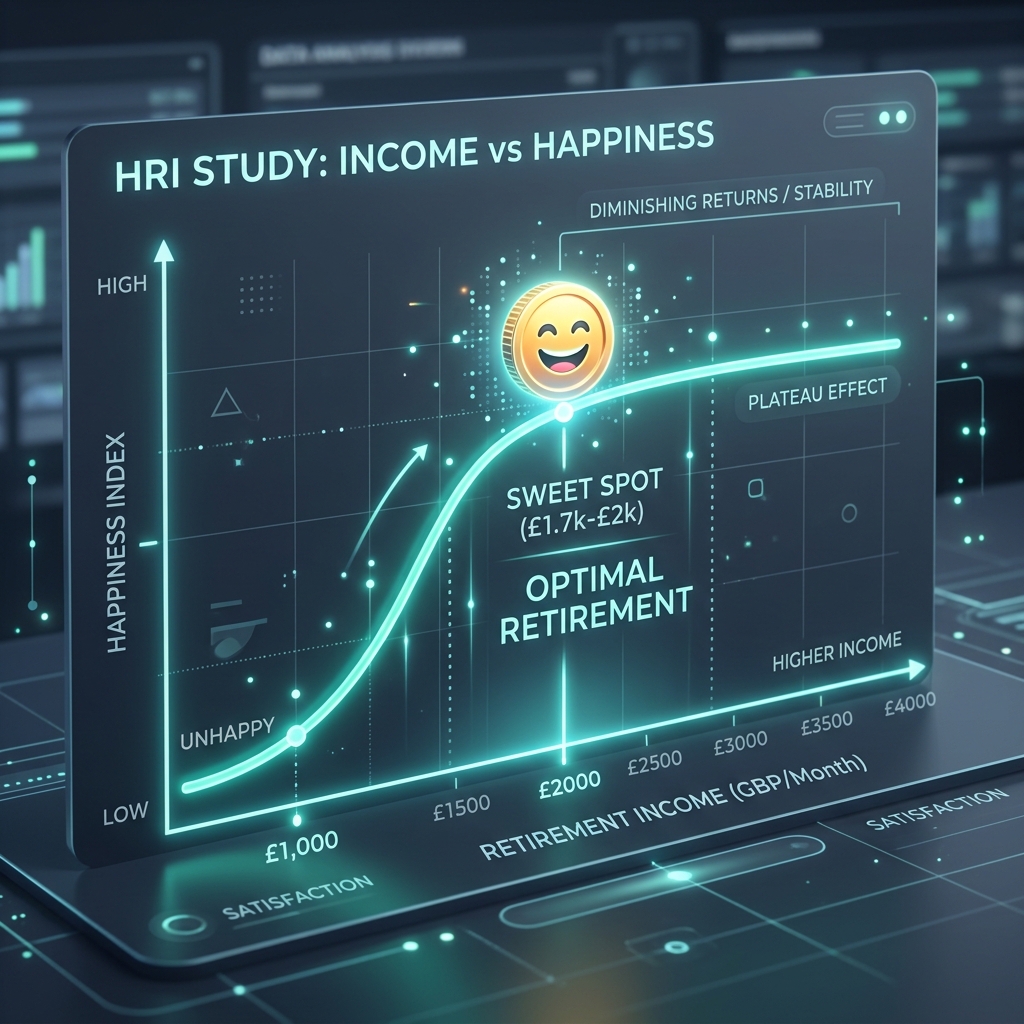
A landmark study by Legal & General and the Happiness Research Institute (HRI) tracked UK retirees to find the exact inflection point where money maximises wellbeing.
The Happiness Sweet Spot: The study found that retiree wellbeing peaked at an average income of around £1,700 a month (£20,400 a year), inclusive of their State Pension.
The Reality Pot: To achieve this level, a single retiree with a full State Pension would require a private pot equivalent to a retirement fund of around £220,000 under the study's assumptions (or around £172,500 if incorporating a 25% tax-free lump sum to purchase an income stream).
The Income Plateau: Crucially, the study suggested that once a retiree's income passes £2,000 a month, additional income was associated with little further improvement in reported wellbeing.
Despite the fact that the majority of Brits will not match an industry-defined "Comfortable" pot, 60% of UK retirees report being "very satisfied" with their retirement, and 33% are "moderately satisfied". Genuine quality of life is driven by free time, good health, and social connections—not larger retirement savings balances.
A Vital Note on the Floor: While large savings are not a prerequisite, you do need a baseline. The study noted that 22% of retirees survive on less than £1,000 a month, which does lead to financial anxiety. Aiming for the £1,700 monthly sweet spot provides a solid safety margin.
3. How Retirees Actually Spend (Debunking the "Retirement Smile")
Financial planners often base their calculations on a theory called the "retirement consumption smile." This model assumes you will spend aggressively in your early active years, slow down in the middle, and then experience a massive spike in spending at the end of your life to cover medical and elder care costs.
Extensive research by the Institute for Fiscal Studies (IFS)—tracking 51 years of real UK data—found little evidence that UK retirees follow the classic retirement spending smile seen in some international studies.
In reality, real weekly spending declines steadily and predictably as British pensioners age, dropping by roughly 1% every single year. This reduction happens across all wealth levels, meaning people aren't spending less because they run out of cash; they spend less because their lifestyle naturally slows down.
Why doesn't spending spike at the end of life? Unlike other countries, the NHS absorbs the vast majority of late-life medical costs. Furthermore, only a small minority of those over 65 ever move into a long-term care home. Because catastrophic, out-of-pocket medical spikes are rare, many retirees may not need to reserve as much specifically for healthcare costs as retirees in countries without universal healthcare, although social care costs remain an important consideration.
4. The Ultimate Retirement Variable: Housing
There is a glaring, dangerous blind spot built into the PLSA numbers and almost every standard online calculator: they assume you own your home outright.
Being completely mortgage-free is one of the strongest determinants of retirement affordability. If you do not have to pay a bank or a landlord every month, your baseline survival costs plummet.
However, demographics are shifting rapidly. While 78% of current retirees are homeowners, that number is projected to drop to 63% by 2041. For the millions who will rent or hold a mortgage in retirement, standard industry targets may prove challenging. Research shows that retirees who rent face day-to-day living costs 87% higher than those who own their properties outright.
When planning your future, your housing status dictates the maths more than any other variable.
5. Building Your Realistic Action Plan
Forget the headlines. To build a target that belongs to the real world, follow this simple roadmap:
Secure the Foundation: Ensure you are tracking toward a full New State Pension by checking your State Pension forecast on GOV.UK and reviewing your National Insurance record. Most people need 35 qualifying National Insurance years for the full New State Pension, although transitional rules mean some people need more or fewer. This provides a guaranteed baseline of £12,548 a year under current rates.
Target the Shortfall, Not the Total: If your personal target is the empirical "Happiness Sweet Spot" of £20,400 a year, and you have a full State Pension, your private savings only need to bridge a gap of £7,852 a year. That is a highly achievable goal.
Max the Match: Aim to get your combined workplace pension contributions (your input plus your employer's match) up to around 12–15% of salary over the course of your career, and let compound interest do the heavy lifting over time.
Build a Personal Profile: Because generic rules of thumb ignore whether you have a mortgage, live in a low-cost region, or plan to travel, you cannot rely on an average.
Calculate Your True Shortfall
Use our custom retirement calculator to plug in your exact age, current savings pot, monthly targets, and pension forecasts to see your true, achievable path.
Plan your retirement, but simplify your taxes today
Don't wait until tax day to get organised. Nurtle is a lightweight, privacy-focused financial companion that handles your HMRC flat-rate WFH expenses, mileage logging, client invoicing, and SA103F tax box mapping without the VAT or payroll bloat.